Category Archives: Uncategorized

Microsoft Q4 FY 2025 earnings: Azure growth accelerates as legacy business applications transition to Agentic AI

August 16, 2025.

As recounted by CEO Satya Nadella, the Microsoft public cloud service provider Azure revenue surpassed $75B, up 34% year over year (yoy), taking share every quarter.  Azure and other cloud services revenue, as reported in the earnings call slides, grew 39% yoy.  Nadella said Microsoft continued to lead the AI infrastructure wave, now with over 400 datacenters, in over 70 regions, more than any other provider. 

Microsoft  stood up over 2 GW of new datacenter capacity in the last 12 months.  1 GW would supply roughly 800,000 homes in the US. This shows how much new power supply the AI revolution is requiring. 

Data:

Knowledge workers require access to relevant data produced by their enterprise, in order to put it to work using applications. In enterprises whose primary function is not data science, access to data must be provided while enabling unified management and relatively low learning curve. Microsoft Fabric is becoming the complete data and analytics platform for the AI era.  Fabric enables access to all of the enterprise data in one application using OneLake, and integrates with the Microsoft ecosystem.  Revenue was up 55% yoy, now with over 25,000 customers. 

Microsoft also supports third party data analytics platforms on Azure.  Azure Databricks and Snowflake on Azure are also growing.  Cosmos DB and PostgreSQL both play crucial roles in operation of critical OpenAI ChatGPT applications.

In the area of Data, Microsoft continues to evolve crucial third party data management tools on Azure. While continuing its close partnership with Databricks, it is growing Fabric as an accessible and versatile tool that adds value to the existing Microsoft software ecosystem, in this way nurturing its competitive advantage of switching costs.  Customers should be able to access the resources they need to evolve innovative applications, while finding the new capabilities they seek, within the ecosystem.

Agentic AI

This year Microsoft launched Azure AI Foundry to help customers design, customize, and manage AI applications and agents, at scale.

Customers increasingly want to use multiple AI models to meet their specific performance, cost, and use case requirements.  Foundry enables them to provision inferencing throughput once and apply it across more models than any other hyper scale cloud provider, including models from OpenAI, DeepSeek, Meta, xAI’s Grok, and very soon, Black Forest Labs and Mistral AI.

Azure AI Foundry includes the Foundry Agent Service, now being used by 14,000 customers to build agents that automate complex tasks.

As a specific measure of usage, the number of tokens served by Foundry APIs, exceeded 500 trillion this year, up over 7X.

The family of Copilot apps surpassed 100 million monthly active users across commercial and consumer.

Hundreds of partners like Adobe, SAP, ServiceNow, and Workday have built their own third-party agents that integrate with Copilot and Teams.  Also, customers use Copilot Studio to extend Microsoft 365 Copilot and build their own agents.  Customers created 3 million such agents using SharePoint and Copilot Studio this year.

GitHub Copilot users have reached 20 million.  GitHub Copilot Enterprise customers increased 75% quarter over quarter. 

In healthcare, Dragon Copilot usage is surging.  Customers used ambient AI solutions to document over 13 million physician-patient encounters this quarter, up nearly 7X year-over-year.  In a typical use case the copilot creates a progress note of the patient encounter based on the dialogue between the physician and the patient.  The physician is relieved of the administrative work of writing the note after the patient has left.

CEO Nadella stated that revenue from Azure AI services was generally in line with expectations. And, “while we brought additional datacenter capacity online this quarter, demand remains higher than supply.”

As legacy applications transition to Agentic AI, Microsoft is adding productivity and capability to its ecosystem, while enabling new capabilities, such as relieving doctors of admin work!  The success of this strategy is seen in the growth of usage of the various applications, from Dragon AI to Fabric for the enterprise, to Agentic AI for large scale customer service organizations.  But this success is based on more than successful usage.  It translates into cash flow, the key indicator of a truly successful business.

The reason for this ability to translate sales into cashflow, is one of the central competitive advantages of Microsoft: scale.  This has two components. First, is the availability of captive customers.  When a new capability, for example Fabric, is launched, sales are efficiently executed across a massive number of existing ecosystem customers.   In addition, software vendor partners multiply this. That is, the new source of revenue is efficiently scaled across a large number of receptive customers. Scale enables the company to be able to afford the cost of development of the product. Costs which include for example employing engineers, and building or modifying datacenter compute.

Second, the costs of incremental new business is quite low for Microsoft’s software business.  There is a minimal additional cost of selling the 2nd or 3rd or 100th instance of the software.  We refer to the costs of development of the software products as being primarily fixed. The cost of selling incremental additional volumes of the software, which might include setting up additional technical support services, which can serve customers globally from one center, are relatively low. These are called variable costs.

Compare with a company like Starbucks. Each new store that Starbucks sets up, requires investment in real estate, new worker recruitment, training, and logistics for the coffee and food products. That store can sell only in its own geographic location. We seek to invest in companies with a scale competitive advantage, and fixed costs outweighing the variable costs.  

The competitive advantage of scale, is what drives high Gross Margin.  For a company where Salary, General and Administrative costs are well controlled, and debt is conservative, therefore generating low Interest Expense, this means that Operating Cash Flow continues to grow, to supply the Capex which enables the company to readily exploit emerging markets. 

 This cash production is impressively made manifest when we consider the ability of Microsoft to ramp up its capital expenditure to eye popping amounts in recent years, while maintaining large amounts of cash flow.

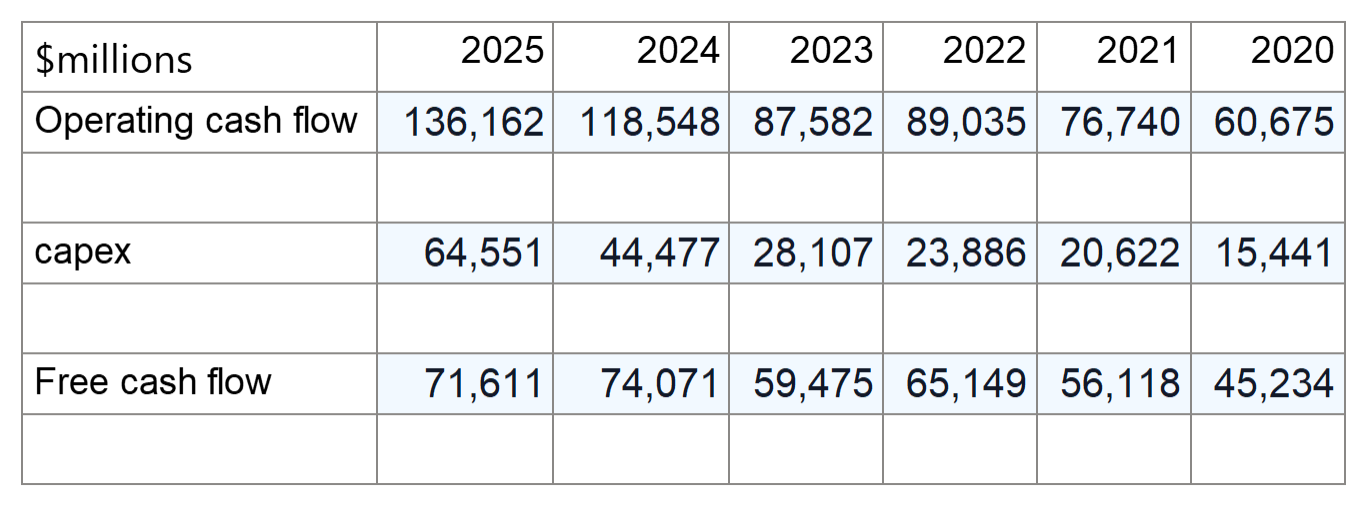
The table above shows Operating cash flow, capex (PPE expense) and free cash flow for Microsoft, from FY 2020 through 2025.  As shown, Microsoft was able to more than triple capex  from 15.4B in 2020 to $64.55B in 2025, while maintaining free cash flow.  While free cash flow decreased slightly from $74B in 2024 to $71.6B in 2025, it is still ample to supply the company’s needs. Out of Free cash flow of $71.6B in 2025, Microsoft paid approximately $24B in dividends, repurchased $18.4B in common  stock, and had $2.4B indebt interest expense.

In comparison, a startup company supplying an analogous product, has a cost of sales and marketing to purchase each new customer. That’s after building or paying for compute capacity. Furthermore, it must supply at a lower price in order to attract customers who would otherwise use the more complete suite available from Microsoft.  This special effort to  take customers from the large scale provider is necessary because the startup lacks the other, more fundamental competitive advantage that Microsoft has, that of switching costs.  Its customers are (not unwilling) captive customers.  Switching costs are sustained by the continuous research and development of increased value provision in the product ecosystem. Ecosystem customers find it more economic to remain in the system. This never ending evolution of the product sustains the customer base, and is essential to provide the basis for scale.

Outlook for FY 2026:

CFO Amy Hood gave the outlook for the coming quarter and fiscal year.

“Capital expenditure growth, as we shared last quarter, will moderate compared to FY25 with a greater mix of short-lived assets. Due to the timing of delivery of additional capacity in H1 (first half of year), including large finance lease sites, we expect growth rates in H1 will be higher than in H2. Revenue will continue to be driven by Azure.

In Azure, we expect Q1 revenue growth of approximately 37% in constant currency driven by strong demand for our portfolio of services on a significant base. Even as we continue bringing more datacenter capacity online, we currently expect to remain capacity constrained through the first half of our fiscal year”.

In summary, as aggressive but prudent expansion of Azure infrastructure and software tools enables the expansion of data analytics platforms and agentic AI, Microsoft continues to advance as an indispensable host and enabler of the AI transformation, while further enriching its ecosystem.

Updated Portfolio Holdings after “Liberation Day”

June 8th, 2025

The market has been somewhat volatile in the year to date, related to dramatic trade policy initiatives by President Trump.  This volatility motivated me to optimize my portfolio holdings.

The policy changes in question centered on the abrupt imposition of large tariffs on imported manufactured goods, especially on the totalitarian Communist People’s Republic of China (PRC), but also on many other countries. This caused declines in stocks of companies which sell goods manufactured in the countries in question.  For example, Apple, which sells iPhones primarily made in PRC, and Best Buy, which sells many products made in Asia, both declined.

This was a significant market decline, a correction (conventionally, a decline of at least 10% in the broad market is considered a correction) of about 19%, not quite a bear market (a market decline of at least 20% is conventionally held to indicate a bear market). The decline was very quick, over less than a month from the S&P500 peak of $6144.15 on February 19th, to the nadir of $4982.77 on April 8th.  Apparently growing investor concern lowered the S&P 500 by 7.7% from the peak on February 19th, to the close on April 2nd.  The index then dropped 12.1% from the close at 5670.97 on April 2nd, Trump’s declared “Liberation Day”, to the nadir 6 days later.  So the bulk of the drop, and of the drama, occurred in the final week of the decline.

When a decline of this magnitude and speed happens, stocks of many companies, and values of other assets, fall, even if their value should not, from a strictly rational point of view, be affected by the factors that caused the market disturbance, in this case the tariff policies. This phenomenon of, “selling the good with the bad” occurs as investors succumb to fear, indiscriminately selling in order to avoid further loss of value.  In addition, assets that have been relatively less affected by the inciting factors, must be sold to raise money to meet margin calls or other liability obligations, hence, the “good” must be sold as the  “bad” loses its value.  Hence, the selling  tends to accelerate, as it were, once a certain trigger is reached.

Further, when market corrections occur rapidly, in the absence of tangible changes in economic conditions as indicated by data regarding recent economic activity, the market generally recovers as quickly, as investors subsequently take advantage of the inviting, lower prices of stocks. 

Therefore, rapid market corrections, accompanied by the customary media and investor hysteria, in the absence of actual deterioration in economic conditions, are a stellar opportunity to buy companies which we wish we owned more of, at sale prices. It is important to note, that buying at this time requires acting in opposition to some people and possibly many, who are urging caution, at least until the market has recovered. Of course, by then, the sale prices have disappeared.

Accordingly, while President Trump’s abrupt approach to tariff policy has been quite hair raising at times, this set of conditions, as it developed in the week after Trump’s “Liberation Day” on April 2nd, stimulated me to reallocate funds to invest to more adequate levels in companies which have a great future.  I sold United Health as it was relatively unaffected by the tariff policy changes. I moved funds from Microsoft and Visa to invest more in Mercado Libre and Nvidia.  I even bought Palantir, before selling at a small gain, as I was not comfortable with its very high valuation.  I also invested a relatively small amount in Arm Holdings.

As of June 7th, my portfolio holdings are as follows:

I have increased allocation to the rapidly growing Mercado Libre and Nvidia.  Previously I was probably too cautious regarding their relative volatility, failing to allocate funds to them even when they had declined by more than 15% from their 52 week high.  Most importantly, in the context of the recent abrupt market correction, this was the opportune time to buy more.  The small proportion allocated to Arm Holdings Plc. was made in view of the recent IPO, with very high PE. The PE was however, falling as revenue grows. Of course, Arm Holdings plc is not a new or untested company. It assumed a dominant market share in ARM chips over the last two decades. ARM chips are rapidly increasing in data centers which are key to the emerging AI related business economy.

Amateur Investor: recent underperformance of the broad US market index S&P 500, but longer term outperformance.

Jan 10, 2025

Annualized Performance (Internal Rate of Return) of Amateur Investor portfolio at 1y, 3y, 5y and 10y (%), as of the last trading day of 2024, is shows in the table below.  Investors might be broadly grouped into those who pursue the future gains in value promised by operating businesses (stock investors), and those who prefer a formally guaranteed stream of income from asset backed securities (Bond investors).  Therefore, I am comparing portfolio performance with the average annual return of securities of interest to Stock, and Bond investors.  The S&P 500 broad US stock market index is represented by The Vanguard S&P 500 ETF (VOO).  The diversified, investment grade bond market, including US Treasury, mortgage backed, and corporate securities,  is represented by the Vanguard Core Bond Fund (VCOBX).

*note VCOBX Core Bond Fund inception was in 2016, so the provided 10-year annualized performance as of 12-31-2024 is that of the fund benchmark.

The S&P500 performed quite well in the past decade, bearing in mind that the average S&P500 return over the last 100 years is just over 10%. Meanwhile, the bond market has not performed as well.  Interests rates remained quite low in the early part of the last decade, and subsequently climbed.  In 2022, the rate of inflation rose in the US.  The Federal Reserve took measures to increase interest rates to correct this inflation. At start of January 2022, rate was 1.637%. At end of December 2022, rate was 3.879%. Bond prices therefore fell. Bond investors began 2023 with a yield not seen since 2010. The bond market did recover somewhat. Meanwhile, investors in the businesses listed in the stock market were exploring growth related to digital transformation, which had been accelerated during Covid; the new focus on AI; and amazing advances in computer chips. Most investors found these prospects more inviting than the bond yields of just under 4%.  Their renewed animal spirits raised the S&P500 index price by 24.23% in 2023, and 23.31% in 2024.

The S&P has not risen by over 20% for two consecutive years since 1997-1998,  which was a very different time from the early 2020’s ….  Come to think of it, the two epochs do share the advent of a transformative digital technology.  Then, investors were enthused over the potential of the internet to drive business reach and productivity. Today, AI is poised to transform productivity.  However clearly in the late 1990s the stock market was reaching into Mania territory, whereas I do not think that is the case currently…yet. But I digress.

Amateur Investor portfolio holdings at end of 2024 are shown in the table below.

The price returns for 2024 of Stocks in the portfolio are shown in the table below.

Amateur Investor markedly under performed the market at 1 and 3 years, and slightly at 5 years.  Microsoft makes up 47.5 % of the portfolio. Microsoft was the worst performing stock in the Magnificent 7 in 2024. Nvidia is the best performing Mag 7 stock this year, but made up only 5.4 % of the portfolio at time of purchase.  It now accounts for 9.94 % of portfolio.

The fact is, because Amateur Investor did not contain most of the Magnificent 7 companies, it did not capture their performance.  The Magnificent 7 companies’ overall strong performance was reflected in the strong S & P 500 return because they make up a significant portion of the S&P market capitalization and total return, accounting for fully 34.6% of the S&P 500 market cap as of June 2024.

There is no specific magic to the success of the Magnificent 7, it is simply a catchphrase for a group of companies which recently achieved the highest market capitalizations, and seem to be popular among investors. I find myself to be unable to heed the siren calls of trendy stock investments. I would rather understand whether and why the key characteristics of a particular business make it a candidate for my portfolio.

While Amateur Investor underperformed the broad stock market in recent years, it outperformed the S&P500 over 10 years.  This shows that the portfolio companies, which over most of that time were MSFT, V and ADBE, are able to consistently grow revenue and earnings, without regard to membership in the club of in-vogue stocks.  This is related to their competitive advantages, which include switching costs, economies of scale and network effects. The more recently added members of the portfolio, MELI, NVDA and UNH, have similar qualities which have been proven over decades of their history.

Things to be fixed:

Possibly the most significant error of this year was the failure to invest enough in NVDA.  This resulted from a lack of consistent research about promising business opportunities in the market.  I only recently learned about Nvidia’s history of anticipating, shaping and adapting to changes in its markets. It has invested massively to achieve this, over multiple decades. Thus, it has come to play a crucial role in the development of the computing power needed for modern business.  It is important to consistently maintain reading habits regarding events in the market and the portfolio companies, while avoiding being drawn into speculative gambles.

Now that Mercado Libre has declined by almost 20% from its 52 week high, I will try to raise its allocation in the portfolio to closer to 10%, in exchange for some stocks that did well this year, such as Visa.

An issue with stocks such as MELI, NVDA and ADBE is their volatility. I feel more comfortable investing a relatively smaller amount with the stock was dropped by at least 15% from its 52 week high. Otherwise the volatility can create some anxiety which must be acknowledged.

Microsoft 2024 Q4 Earnings Call: Microsoft strains to meet AI Datacenter Demand, AI Product Usage Ramping.

August 15, 2024. In the current tech company earnings season, a pressing concern in the investment community is that AI related applications may be exacting more capital investment than is justified by their usefulness and profitability to businesses.

Businesses are beginning to depend on AI. But indeed it may not be possible to clearly foresee the many ways it will actually be used, even as it becomes integrated into daily business functions.  And this normal uncertainty, arouses concern, given the very high level of investment required to build the computation resources required for AI.  The investment community has become concerned that AI related capital investment may strain the corporate balance sheet, reducing cash flow and increasing debt. 

One of the core traits of MSFT culture of operations is that it seeks to adapt and exploit its competitive advantage in a profitable way. The company has never commoditized its products and has avoided being vulnerable to the boom/bust cycle of some tech hardware companies. It has a differentiation strategy and strong competitive advantages of switching costs, largely based on software application usage and platforms.

In the webcast of its 4th Quarter of 2024 Earnings, Microsoft CEO Satya Nadella and CFO Amy Hood explicitly articulated that they are conservative in spending on building infrastructure needed for AI workloads, and that in fact demand by their customers for AI computation is outstripping the company’s ability to supply the computing infrastructure.  The deficit in available AI computation is partly relieved by leasing datacenters from companies which maintain large datacenter assets such as Oracle. These have the advantage of being relatively short term leases, purportedly until Microsoft can establish its own new datacenters, and this helps avoid overinvesting.

CEO Nadella emphasized, as one of two corporate goals in navigating the platform shift of AI, that they are using “customer demand signal and time to value to manage our cost structure dynamically and generate durable, long-term operating leverage. “

(The first strategic goal was, no surprise, driving innovation in infrastructure and applications products, while continuing to scale the cloud business, and prioritizing security.)

As per Nadella, AI was central in MSFT progress this quarter. Azure share gains were driven by AI.  Azure growth included 8 points from AI services where demand remained higher than their available capacity.

Despite the incipient growth of the AI business, cloud margins remain extremely strong.  As CFO Amy Hood stated, Microsoft Cloud gross margin declined from 72% to a still excellent 69%, driven by sales mix shift to Azure, partially offset by improvement in Azure even with the impact of scaling AI infrastructure. Microsoft Cloud includes Azure and other cloud services, Office 365 Commercial, the commercial portion of LinkedIn, Dynamics 365 and other cloud properties.

To get a high level view of the ability of Microsoft to lay out Capital Expenditure (Capex) needed to grow its business, including AI, we can compare the growth of capex, net income,  free cash flow (FCF), and revenue, over say, a decade. 

Based on review of the relevant Annual Reports, in the decade from 2015 to 2024, Revenue increased 2.6X from  $93.580B to $245.122B.  Net income to common shares rose 7.2X from $12.193B to $88.136B, as operating and nonoperating expenses rose less than income.  Capex rose 7.5X from $5.944B to $44.477B.  Capex accelerated throughout the decade, and ramped up sharply in 2024.  Of the rise in capex between 2024 and 2015, 42% of this rise took place in 2024 relative to 2023.

Microsoft businesses generate enough cash to fund Capex needs and more.  Even with accelerating Capex, Free Cash Flow (FCF) still increased 3.1X from $23.724B to $74.071B. IN 2024, debt interest coverage is still over 20x, and Debt/Equity ratio at end of 2024 was at the lowest level in the decade. 

Remember that FCF is primarily cash remaining after capex expenditure has been subtracted from the cash flow from operations.

Therefore, Microsoft has shown it can generate the cash required to supply capex to adapt and grow its business as cloud computing and AI shape its markets.  Given its historical record extending back decades, I think it is safe to assume it will continue to do so.

The company outlook forecast for 2025 capex was that it would be larger than 2024.  Let’s hypothetically assume capex doubles from the 2024 level of $44.477 billion to $88.954B (note that annual doubling of capex is unprecedented in the history of Microsoft). Given that operating cash flow has increased at an average annual rate of 14.47% for past decade. Assuming operating cash flow in 2025 increases at this same rate over that of 2024, making $135.144 billion. Then hypothetically FCF in 2025 would be $135.144B – capex of $88.954B = $46.190B.  This is a significant decrease from the 2024 level of FCF, of $74.071B.

Should the company be faced with persistent jumps in Capex requirements, we might be concerned to estimate when the resulting datacenters will produce revenue to maintain cash flow at its accustomed growth level. In this, we can look to clues which the leadership team gave at the earnings conference. 

Just taking two instances of AI related products, we see signs of AI-induced growth in usage and revenue which are promising.

Copilot for Microsoft 365.

Copilot for Microsoft 365 is becoming a daily habit for knowledge workers as it transforms workflow.  The number of people who use Copilot daily at work nearly doubled quarter-over-quarter, as they use it to complete tasks faster, hold more effective meetings, and automate business workflows and processes.  Copilot customers increased more than 60% quarter-over-quarter.

Feedback has been positive, with majority of enterprise customers coming back to purchase more seats.  The number of customers with more than 10,000 seats more than doubled quarter-over-quarter. 

With Copilot Studio, customers can extend Copilot for Microsoft 365 and build custom copilots that proactively respond to data and events using their own first and third-party business data.  To date, 50,000 organizations – from Carnival Corp., Cognizant, and Eaton, to KPMG, Majesco, and McKinsey – have used Copilot Studio, up over 70% quarter-over-quarter.

 Copilot is being extended to specific verticals, including healthcare, with DAX Copilot.  More than 400 healthcare organizations – including Community Health Network, Intermountain, Northwestern Memorial Healthcare, and Ohio State University Wexner Medical Center – have purchased DAX Copilot to date, up over 40% quarter-over-quarter.

Github copilot

GitHub Copilot is by far the most widely adopted AI-powered developer tool.

Just over two years since its general availability, more than 77,000 organizations – from BBVA, FedEx, and H&M, to Infosys and Paytm – have adopted Copilot, up 180% year-over-year. “Copilot accounted for over 40% of GitHub’s revenue growth this year, and is already a larger business than all of GitHub was when we acquired it. “.  I assume that means revenue from Github Copilot is larger than Github revenue was, when acquired by Microsoft for $7.5B in 2018.  And Github has a current annual revenue run rate of $2B.  So, not only is its usage growing, but this has been turbocharged by Copilot AI.

In summary, based on review of relevant past financial disclosures including Annual Reports, the Q4 2024 earnings conference, and understanding of Microsoft business culture as it has operated historically, Microsoft should be able to continue to spend as required for Capex to build out AI and cloud computation.  Growth in usage of AI-related products should lead to continued earnings growth. Most importantly, over the long run, the novel AI-related features will become indispensable tools for knowledge workers and will confer the strong competitive advantages of switching costs which enable Microsoft to keep dominating its markets.

Nvidia: a company in a cyclical industry, with a competitive advantage

June 15, 2024. A quantitative feature that I have used to help identify companies with a durable competitive advantage, is the relatively consistent growth of revenue over many years.  I reason that the persistent climb in revenue is related to the indispensable nature of company products or services, with related durable competitive advantage, and to a large, persistent demand for them, commonly referred to as a “long runway” of persistent total addressable market.  I had avoided cyclical companies, whose stock price rises or falls with the demand cycle.  In order to obtain a superior return, you need to buy at the bottom of the cycle. But in practice it is difficult to know when the company’s fortunes will recover, or when the stock price will stop falling.

Visa and Microsoft are examples of companies with strong competitive advantages and products that are indispensable for large and growing markets.  Since its IPO in 2008, Visa’s  sole decrease in annual revenue occurred in 2020. Government policies enacted during the history making Covid 19 pandemic abruptly curtailed international travel. The fall in purchases by persons travelling internationally slowed cross border payment volumes.  Impressively, Visa total annual revenue did not decrease during the Great recession of 2008-2009.

Microsoft has had minor if any decrease in revenue except in 2009 due to great recession.  In that economic crisis, primarily revenue from Windows software sold to corporations (the Client business segment) decreased, and price cuts for gaming software and hardware slowed gaming revenue.  By 2010 both revenue and earnings exceeded the 2008 levels.  Of note, revenue from the Business Division, including the Office suite of productivity software, was essentially flat. This product was more economically resilient because it has powerful switching costs and generates revenue largely through multiyear contracts.

Nvidia was brought to my attention by the rise of Artificial Intelligence (AI) in public awareness.  Review of its Annual Reports , shows that Nvidia has in the past had prolonged decreases in revenue and earnings, related to adverse macroeconomic conditions. For instance, in 2009 revenue decreased relative to 2008, and did not recover until 2013. Diluted Earnings per Share decreased as well in 2009, showing a loss in 2009 and 2010, and not recovering the level of 2008 until 2017.  In previous periods of its history, rising costs caused earnings to show multiple years of losses or declines without a loss of gross revenue.

Revenue and earnings fell during the Great Recession because Nvidia at that time, derived most of its revenue from products for the PC market. In FY 2009, desktop GPU product sales decreased 29% year over year.  Moreover, cyclical decline can have prolonged effects. PC makers build inventory during periods of anticipated growth. They are left with excess inventory in the event this growth fails.  They can then delay additional purchases of the GPU inputs to PC manufacture, until end customer demand has resumed.

The datacenter GPU business segment, which now contributes the lion’s share of Nvidia revenue, did not yet exist in that era.

And yet, during the period of the Great Recession of 2009-2009, the research engineers at Nvidia were laying the foundation for its history making advances and competitive advantage of the next decade and more.

During 2008 as the global financial crisis accelerated, Nvidia “announced a workforce reduction to allow for continued investment in strategic growth areas… we eliminated … about 6.5% of our global workforce. … expenses associated with the workforce reduction, totaled $8.0 million. We anticipate that the expected decrease in operating expenses from this action will be offset by continued investment in strategic growth areas. ” (Nvidia 10K FY 2009) (Nvidia Fiscal Year ends in January of that year, so it reports on business activity occurring chiefly in the previous calendar year). 

Indeed, R&D expenditures continued to climb during this period.  In fiscal years 2008, 2009, 2010, R&D expenses continued to climb, making up 17%, 25% and 27.3% of revenue for the respective years. (Nvidia 10K FY 2010, p36).

Nvidia GPU chips were originally designed for use in gaming and graphics software applications and by the mid-1990s Nvidia had come to dominate that market. The company IPO’d in 1999. In 2006 Nvidia conceived CUDA, a software platform that enables software to employ the parallel processing and accelerated computing of the GPU, for diverse applications other than solely graphics.  It supports a range of languages and a comprehensive armamentarium of tools allowing it to be used for a wide range of applications. CUDA builds competitive advantage in several ways. The CUDA software platform enables engineers to use accelerated computing driven by Nvidia GPU chips, for a wide variety of other useful and novel applications. This expands the addressable market of use cases for the GPU. Nvidia has fostered an ecosystem of software centered around diverse applications of CUDA, collaborating with myriad companies in diverse industries, from healthcare to pharmacy to automotive, to nurture vertical stacks of software supported by the CUDA platform. Approximately 5 million developers in that ecosystem create a network effect competitive advantage for other GPU manufacturers such as AMD. CUDA is compatible only with Nvidia chips. While it is optimized for upcoming, ever more potent chips, the software ensures backwards compatibility, so developers and end users can often update application software with their current hardware.  There is a strong switching cost competitive advantage versus other chip makers.

Nvidia is one of the rare companies that has consistently done the massive, risky work, anticipating emerging market segments, to  persistently adapt its competitive advantage to continue to dominate the market as it evolves.  During these decades, beginning well before the advent of real AI in 2012, and continuing today, the cultivation of the CUDA centered ecosystem, along with consistent hardware innovation including strategic acquisitions, enabled Nvidia to come to dominate the market  for datacenter GPUs and related high performance computing equipment which is required for AI.

Some general and striking realities about Nvidia’s current competitive position are fairly clear.  There is high demand for AI and accelerated computing capability, and it is not a transient fad.  The use cases are becoming permanent fixtures in the evolving economy. For example, AI is raising productivity of knowledge workers, and widening accessibility to computing applications by making them easier for non-specialists to use.  Accelerated computing makes attainable tasks previously too large to take on. For example, it enables health systems to harness their unstructured clinical or administrative data to yield insights regarding care provision or costs. Virtual digital twin factories can be designed and tested before building the actual plant, avoiding costs of trial and error.

It is clear that the accelerated computing that makes AI possible, largely requires Nvidia products. Specifically, these are the datacenter computer chips needed for accelerated computing, and the technology and software tools needed for the datacenter to efficiently produce (train) and work (inference) with AI models. 

Based on company communications to investors, demand is predicted to persistently outstrips supply.  In view of innumerable essential use cases, the runway and total addressable market is massive.  Nvidia commands at least 80% market share. Most likely revenue and income of the company will climb for some time.

With cyclical companies, there is the concern about avoiding stock purchase at the peak of the cycle. Nvidia stock fell in the macroeconomic perturbations of 2022, among predictions of recession and rising interest rates.  The PE in the quarter ending October 30, 2022 was about 60. It was 50 at the end of the quarter ending in April 2024.  Meanwhile, revenue had climbed more than 4 times, and earnings had grown 20X. 

Therefore it seemed, especially in view of the expectation for continued revenue growth, the stock was not overvalued.  I decided to reallocate some funds from United Health Group (UNH) to Nvidia.  Which I did on February 29th, at a purchase price of $793.16 with 5.4% of my portfolio in Nvidia at the close. The stock has since split 10 to 1.  At some time, it may be that demand for Nvidia data center products will decline. That is not happening soon.  At some point, Nvidia may become involved in a financial mania related to AI. That point has not yet arrived. Should it do so at some point in the future, I might reallocate some funds back to a non-cyclical company, such as United Health Group.

Mercado Libre (MELI) transformed scarcity into competitive advantage

May 9, 2024.

Mercado Libre is an ecommerce and fintech company operating in Latin America (LATAM).  Mercado Libre was established in late 1999 by cofounder and current CEO Marcos Galperin; headquartered in Uruguay, and incorporated in Delaware, USA.  It started operating initially in Argentina in August 1999, by the end of the year had added Brazil and Mexico, the largest regional country markets. By the end of 2000 it added Venezuela, Uruguay, Colombia, Chile and Ecuador, and continued to expand. It IPO’d in 2007.  It currently functions in 18 countries, including those previously mentioned, and Bolivia, Paraguay, Costa Rica, Dominican Republic, Guatemala, Honduras, Costa Rica, Nicaragua, Panama, and El Salvador. That is, all the Spanish speaking countries in the region plus Brazil.

MercadoLibre has become the largest ecommerce company in LATAM by revenue and unique visitors, as well as one of the leading fintechs by revenue.  It is the surviving victor of a competition, over the course of its lifetime, with a number of regional and international ecommerce companies.  This accomplishment speaks to the quality of the management and strategic success.  I avoid novel companies. The historical record of MercadoLibre demonstrates that its management and workers are able to make the correct decisions and execute to continue profitable growth. 

Given the strength of Mercado Libre’s human capital, this combines with Mercado Libre’s origin in LATAM in explaining some key traits of its history, as well as its particular strengths. In particular, Mercado Libre originated in an environment of scarcity of some needed resources.

Internet penetration is relatively less developed in LATAM, in the region of 70%. Accordingly, Ecommerce is also less mature. Online retail sales are about 5.6% of total retail sales, whereas in US they are 14%.  However, both internet usage and ecommerce penetration are growing quickly. Approximately 192 million people in LATAM have shopped online, in 2024 this is expected to grow to 350 million. Of note, ecommerce growth requires popular participation with specifically digital finance tools, such as mobile or online payment apps, or virtual credit cards, not necessarily with traditional banking.

Public Transportation networks

The relative unreliability of state provided postage and delivery services, has provided an opening for Mercado Libre to build its own Logistics network. Mercado Envio has successfully enabled more efficient delivery than government networks. Moreover, a potential competing ecommerce business would either take the easier route of using Mercado Envio, or it would have to undertake the task of repeating the investment of fixed capital to replicate the Mercado Envio network. 

Significant Unbanked Population

A significant portion of LATAM population is underbanked, not participating in the modern digital (non-cash) financial system, and not able to participate in ecommerce.  For instance, less than 50% of the population in Latin America have a consumer financial institution account, whereas about 90% has the same in the US. This made it necessary for Mercado Libre to build a digital payment system and attract users, in order to enable consumers to use its ecommerce. This was Mercado Pago.  In 2013, Mercado Pago had 28.6% penetration in payments on Mercado Libre platform. By 2017 this share had reached 81.9% and was no longer tracked in the 10Ks.

Whether the numbers given are precisely accurate is less important that what these patterns signify.  They mean that MercadoLibre, in the course of growing into the largest ecommerce and digital payments platform in Latin America, has sat its disposal a runway of growth that is expanding in a way is qualitatively different from that for digital payments or retail companies in more developed countries.

Conversely, the conditions of scarcity of needed resources under which the company developed in the regional markets posed sharp challenges to company growth.  MercadoLibre management took these on. And paradoxically, these challenges gave it opportunities to build a competitive advantages that are more comprehensive than those available to ecommerce players in more developed countries.

As CEO Marcos Halperin described:

In 1999, our company was a marketplace, an online auction site. We had not created Mercado Pago, Mercado Envíos or the other solutions and tools that enriched our value proposition to form the ecosystem that today makes life easier for millions of people in the region, reducing gaps and promoting development. When we started, those business units were not even ideas. But problems appeared, we turned them into challenges and generated solutions. We took risks with each of them, we had successes and errors, we learned, innovated and achieved the impact that inaugurated new paths” .

This is one of a series of articles on Mercado Libre.

Q1 2024: Adobe beats as usual Earnings and Rev estimates, but Stock sells off on worry about near term growth

March 18, 2024. In the First Quarter (Q1) of fiscal year 2024, Adobe beat earnings and revenue expectations.  One of the take-home messages of the earnings call webcast was that monetization of AI related features would be apparent in the second half (H2) of the fiscal year (Adobe fiscal year ends in very early December, so H2 would start in very early June).   While Adobe beat analyst earnings and revenue expectations for Q1, its guidance, predicted rev and earnings for Q2 2024, was less than what analysts had expected, calculated.  Did this affect their financial discounted cash flow models, which determine whether the stock price represents a worthwhile purchase point?  Presumably this is why the stock briskly sold off about 13% after the earnings release.   If we go ahead and attribute a rational justification to the revaluation.  Company leadership, including CEO Narayen, repeatedly stated that guidance of predicted revenue and earnings for the entire fiscal year 2024, which had been made at the earnings release for q4 2023 as per custom, were unchanged, and that accelerated usage of apps and forthcoming monetization of AI related features was proceeding apace and quite satisfactorily.  The CEO outlined that the accelerating proliferation of digital content resulting from the spread of AI related software, increases demand for the Adobe suite of media editing software, which is the best positioned to effectively function in a commercial environment in which copyright must be respected, and in which the digital content editing process must integrate in the corporate workflow, which includes related downstream usage for digital marketing.  

I am making no change in allocation to ADBE. Why do I choose to trust the leadership word that revenue and earnings will remain satisfactory this year?  ADBE consistently beats rev and EPS expectations.  This can be easily seen for example on the https://www.msn.com/en-us/money personal investing website.  Find ADBE, earnings, earnings history.  More fundamentally, the competitive advantage of ADBE enables it to successfully compete with potential rivals.  This competitive advantage lies, just as CEO Narayen outlined, in the market dominating position of Adobe creative software in companies. Adobe is reinforcing and adapting its market dominance here by adding the new capability of AI. As AI is integrated progressively into creative and digital marketing software applications, on one hand it becomes more efficient to create sophisticated content and use it more effectively in digital marketing. This raises value provided per cost to the client.  Just because AI may mean that fewer professional designers are required in existing projects, does not mean they won’t be employed in new projects elsewhere. On the other hand, AI tools mean content creation becomes easier and can be used more widely in the enterprise and out of it, by non-professional creators. In fact, overall demand for digital content creation is accelerating and this means more demand for Adobe software.

Context of Competitive Advantage in the Health Care Insurance System.

Feb 15, 2024. In early 2023, I became aware that United Health Group (UNH) was likely to possess a durable competitive advantage, since it had evolved over about 40 years to become a market dominating company, with an impressive total stockholder return. In order to discover the basis for this competitive advantage, I searched in vain for a book written by or about UNH founders or the company history. I did find a book about the US Healthcare insurance system history: Ensuring America’s Health: the Public Creation of the Corporate Health System. Christy Ford Chapin, published 2017. The following historical outline of the US health insurance system takes liberally from this interesting book.

From the inception of the income tax in 1913, fringe benefits including employee health insurance, were made tax deductible. Over time, public demand grew for comprehensive health insurance.  At the time of price controls during the war time economic policies of FDR, employers offered the tax-deductible employee health insurance fringe benefit to augment compensation and attract workers. The employer tax deduction for employee health insurance was more specifically codified in the Internal Revenue Act of 1954.

In insurance markets other than health insurance, the insured outcome is something that all parties to the insurance contract have an incentive to avoid.  A driver tries to avoid car damage, a home owner avoids burning his house down; the insurer certainly shares the sentiment. As premiums exceed claims most of the time, the company can accumulate a “float” of funds to be invested in order to earn additional income and build the financial resources to fund future claims. The size of the financial reserves thus accumulated, is the basis for the insurer’s promised ability to back claims successfully.

In contrast, in the health insurance market, the customer finds it desirable to make claims for service, a sentiment shared by the provider, and there are no clear  definitions as to what services are legitimately necessary for health. This means that health insurance is unprofitable in the sense that claims paid will tend to approach premium revenue, leaving no room for accumulation of float.  This means that it is a peculiar property of the US health insurance market, that the insurance company must be an important arbiter of the reimbursement rate for health care services.   Because in order to be profitable, the insurance company must devote systematic attention to controlling medical costs, where neither customer nor service provider have an incentive to do so.

Because of the poor economics of health insurance, early (following the Great Depression era) insurance policies covered a limited range of essentially catastrophic coverage.  In the 1940s employers began to offer naturally desirable more comprehensive health insurance partly to stymie labor unions’ influence.  As private insurance spread rapidly to become a popular benefit, unions demanded comprehensive coverage for their members as a counter for moderated wage increase. Physicians’ groups encouraged private insurance, while insisting on fee for service, and fended off insurer influence over reimbursement or choice of care. Physicians feared insurer restrictions on price and provider independence, which they considered to be a gateway to government sponsored coverage and associated control of reimbursement and practice. Private insurance companies, while unsettled about low margins, had similar fears regarding the development of government insurance, therefore tended to supply demand for progressively more comprehensive policies.  Their business grew rapidly.  Health care insurance was paid for by a third party, namely the employer, union or government. Regarding government payment, at this point in history, it was the growing Federal Employees Health Benefits Program which paid for and in effect subsidized private insurance for federal employees.  With prices determined by providers and ancillary healthcare service or equipment providers, who could be confident their costs would be covered, consumers were not restrained by prices, and healthcare price inflation exceeded that in the rest of the economy.

In the absence of other restraint on prices, private insurers gradually began to take a role in determining reimbursement. They were aided over time and experience by the evolution of actuarial data needed to do this effectively. As health insurance became more comprehensive, the many claims to be covered, involved innumerable conditions and treatments.  Over time, the complex data sets needed to make sense of claims administration were developed, at times including data sharing among different companies. This developed expertise in controlling reimbursement costs.

Healthcare inflation was a public policy issue which led to the formation of Medicare and Medicaid, the feared government sponsored plans, after at least a decade of discussion and negotiation. By that time the private health insurers had established a business infrastructure to address billing and payments.  In the political conflict between proponents leaning toward a government single payer system and those for private insurance, the use of the private insurance company model to administer the government sponsored systems, subject to government regulation and funding, was appealing as a viable compromise.

The creation of fully government funded health insurance, administered as it was by private insurers, who would thereby profit, meant that the private insurer model was further embedded in the structure of the US health care.  As price inflation did not abate, the insurance companies gradually increased their control over reimbursement, leading to DRGs, formation of HMOs, PPOs, and the current system, of which value based care is the latest attempt to maximize value per cost, while optimizing outcome as a value to the customer.

In summary: private health insurers play an indispensable role as mediator, or market maker, in the US health system.  They insure comprehensive health insurance, which most of the population regards as indispensable.  This is paid for at least as a strongly established expectation, if not legal entitlement, by employers and, ultimately, state and federal government. Because of the natural incentive to consume healthcare, in the peculiar economics of healthcare insurance policies, claims made tend to chase the level of premiums revenue, and gross margins are correspondingly attenuated.  But because of inexorably expanding demand, and reliable payment for insurance, health insurer revenues will tend to continue rising.  A company which has a market dominating position in this ecosystem, has access to total addressable market which will likely grow for the foreseeable future.  Market growth is driven by population growth, especially of the aged; increase in price and frequency of utilization; increase in government funding, among other factors.

The question remains, how can a company establish a market dominating position in this system? It would need to widen the gap between claims expenses and premiums revenue; that is, minimizing the medical loss ratio (MLR), funds paid for medical costs of members, divided by premiums revenue.  By economies of scale, in which an insurer accesses a relatively larger population of customers (potential patients) as members, it could demand relatively lower reimbursement prices from healthcare providers.  Meanwhile, access to a large number of providers attracts contracts from large corporate employers and large numbers of individuals, government entities or other payors. Moreover, it can build access to a diversified network of healthcare facilities that build on mutual synergies, to encourage lower prices as well as attract business from payors.  For instance, association with a large number of rehabilitation medicine providers could lead them to accept a lower reimbursement bid, if the insurer is also associated with a correspondingly large number of referring orthopedists. 

Other than minimizing the MLR relative to premiums revenue, the health insurer could create additional revenue streams by selling other services, derived from its experience in insuring, that raise productivity and lower costs for its customers as well as providers. For example, healthcare billing software, clinical pathway analytics, pharmacy services. 

Finally, the insurer could build or acquire healthcare providers that are incentivized to reduce cost relative to value through management guidelines developed by the previous insurance experience.

In a subsequent article, I will outline how United Healthcare uses these strategies to maintain a consistent competitive advantage relative to other insurers.

Discovering United Health Group (UNH), a Novel Portfolio Holding.

Feb 9, 2024.  In 2022, risk-on stocks in the US markets fell.  My portfolio holdings at the time, Microsoft (MSFT), Adobe (ADBE) and Visa (V), all growth stocks, participated to varying degrees.  They all have persistently high gross and net margins, and consistently high returns on invested capital. These are key signs of the presence of a durable competitive advantage of their business, and these are traits I screen for in routine searches for investments.  In spite of their outstanding financial accounting features, all were falling in 2022. MSFT and ADBE especially had price earnings multiples which had been climbing for years, based on expectations of continued earnings growth. They were therefore vulnerable to a downward revision of earnings expectation.

But not all stocks in the market were falling.  I wondered, was it possible that there were companies with strong business qualities, but which I had previously failed to identify as investment candidates, because their financial statements had features which differed from those of my customary investments?  I reasoned that furthermore, such undiscovered businesses would likely have historical returns which did not necessarily correlate with those of my current portfolio holdings. 

Somehow, sometime in late 2022 I discovered, or was affronted by, the somewhat outrageous but undeniable fact that the largest public health insurance company, United Health Group (UNH), had an average annual return since its IPO, higher than that of the mighty MSFT. As of Jan 31, 2023, using a free online stock total return and dividend calculator, I found the average annual return of UNH since IPO on Oct 16, 1984, was 26.14%.  This beating MSFT, which since its IPO March 16, 1986 had a average annual return of 25.14%.

How could this be?  In order to find some basis for the first-class total stock return of United Health Group over its history as a public company, I naturally needed to check out its financial statements and relevant ratios. One pretty good source of this information that I use is stockanalysis.com.  There, I found that in the past 10 years, UNH gross margin was never as high as 30%, and net profit margin barely reached 6% in 2022. These poor margins were the reason UNH had been rejected in my occasional screens for good investments up until now. 

Brief research into UNH history told a story of a company which grew through mergers and acquisitions as well as organically, to become the dominant public diversified health insurer.

Upon further review of UNH  financial statements and ratios, we do see some inviting accomplishments over the past 10 years. Notwithstanding relatively low profit margins, revenue has grown consistently. Annual earnings growth has outpaced revenue growth, suggesting economic value added. Return on invested capital (ROIC) has been in mid-teens. Return on equity (ROE) has been over 20% for most of the past decade.  Return on assets (ROA) has been almost always lower than 8%; balance sheet assets, including goodwill, have grown along with revenue. This is likely because UNH has grown through acquisitions. Liabilities have kept pace and in fact grown a bit faster than equity, However, the  debt/ equity ratio has usually ranged between approximately 50% and 75%. Indebtedness has grown somewhat but interest coverage is still about 10x currently.

We see evidence of consistent consideration for shareholders. The company paid dividends annually since 1990, and increased the dividend annually since 2010. Consistent growth in free cash flow, accompanied by reduction in number of shares outstanding.

The combination of sound financial statements and the world class shareholder return since IPO in the 1980s, suggests the existence of a durable competitive advantage, interestingly, in spite of the narrow gross and net profit margins. The longevity of the company implied it had successfully adapted to maintain its competitiveness in the evolving healthcare market.   Durable competitive advantage, and the ability to continue adapting its product in a profitable way, to the market as it evolves, in order to perpetuate the company’s market dominance, are the seminal qualities of my favored type of long equity investment, which I term the “eternal company”.

How could a company continue to grow its earnings over 5 decades, surviving 6 recessions, while earning a net profit margin of less than 6% ? I endeavored to discover the history and basis for UNH competitive advantage, which I will describe in a subsequent article.

Amateur Investor trails S&P500 for 2022, beats over longer terms.

March 24, 2023.

Amateur Investor’s longer term, 5 and 10 year performance is approximately twice that of the broad stock market index. However, the more recent 1 year return is almost a third (31.6%) worse. Therefore, AI did not escape the bear market of 2022.

Average Annualized Returns for Amateur Investor portfolio, as of 12-31-2022, with comparisons.

1y(%)3y (%)5y(%)10y(%)
Amateur Investor-25.66.916.719.3
S&P 500-19.45.97.510.4
Vanguard Long Term
Treasury Index Fund
-29.4-7.63-2.40.49

The broad market decline which occurred in 2022 is associated with several related changes in the US and global economy. These include: government policies regarding the “energy transition” intended to “renewable” energy sources, intended to “reverse climate change” which increase the price of normally used energy sources (coal, oil gas); disruptions to trade caused by the war in Ukraine.  These changes caused inflation and hindered economic growth. Excess government fiscal stimulus spending exacerbated inflation.  In an effort to reverse this, the Federal Reserve began raising the Federal Reserve Funds Rate in March 2022.  Increasing interest rates are intended to further slow the economy.  This prospect can threaten the growth of companies’ earnings.

The rise of Treasury rates naturally also more directly affected Treasury Bond prices.  I included the performance of a long term treasury bond index in the above table showing portfolio performance. When one is apprehensive because of a market decline, one might be tempted to seek safety in bonds, especially in the perceived stability of U.S. Treasury Bonds.  But bonds do not necessarily provide a safe haven in terms of return on investment in the short run.

How might we have mitigated our losses in the bear market? By being more aware of current macro economic changes, and responding to them by including in the portfolio, companies in sectors which are responsive to diverse macroeconomic factors. Specifically, companies which benefit from the same changes which threaten other companies, as well as companies which are relatively unaffected. Nevertheless, given that growth stock prices will inevitably fluctuate, our companies are still extremely profitable, dominate their markets, and continue to innovate in order to continue their growth and dominance. More on the value and productive method of diversification, in a future post.

Amateur Investor holdings, by percentage, as of 12-31-2022:

Microsoft (MSFT): 52.79%

Visa (V): 28.74%

Adobe (ADBE): 17.75%

Mercado Libre (MELI): 0.44%

Please welcome Mercado Libre https://investor.mercadolibre.com/investor-relations as a new arrival to the portfolio. Mercado Libre is an ecommerce company operating in Latin America. It is by far the dominant market leader in the region. Latin America has an internet penetration rate in the 70s%, and fast growing. MELI provides a suite of ecommerce related solutions: Mercado Libre Marketplace (online retail platform), Mercado Envios (shipping and logistics), Classified Ads services, Advertising services, and Mercado Pago (diverse payment solutions). I began by investing an almost irrationally small amount on August 4, 2022, at $1037.82 per share. This is simply a mark of the anxiety I usually have around a brand new investment.